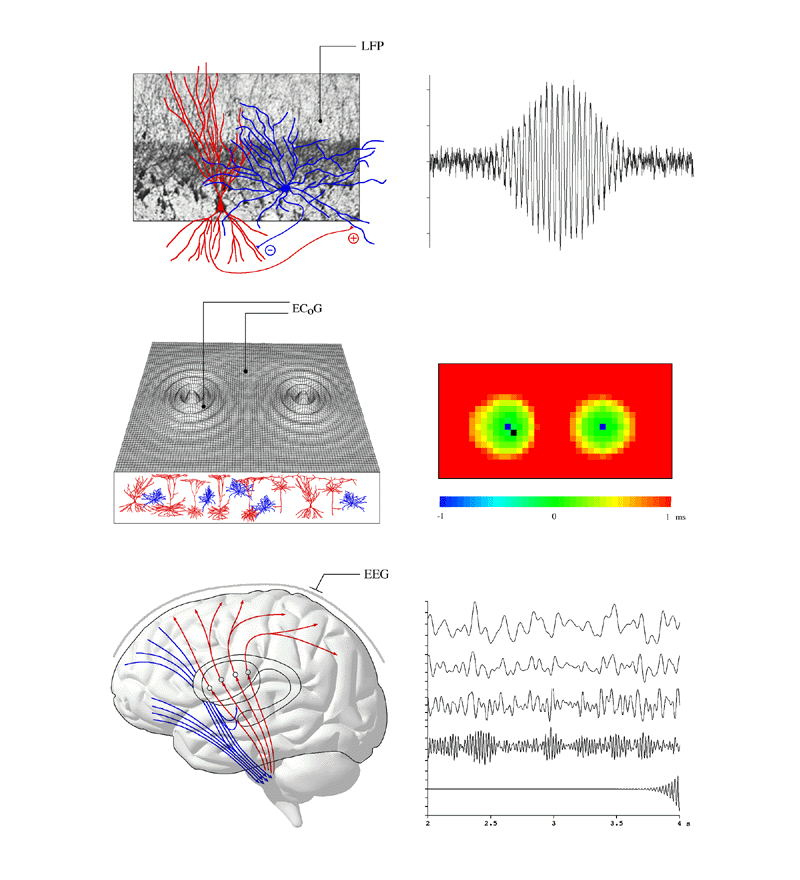
 Figure 1
The top left panel of figure 1 shows two representative cells within the cerebral cortex - one red (an excitatory "pyramidal" cell) and one blue (an inhibitory "stellate" cell). Populations of these cells are linked together densely in the cerebral cortex. Top right panel shows the gamma band local oscillation which emerges when the locale of cells becomes sufficiently excited. The middle panels of figure 1 show how at a larger scale, these foci of excited cortex generate waves of cortical electrical activity spreading into the less excited surrounding cortical tissue (middle left panel). The resulting wave activity can be analysed by cross-correlation, as shown in the middle right panel. Here the lag time for maximally correlated activity (with reference to the recording site shown in the left middle panel) is displayed for the extended field. It is seen that the foci of activity have entered "synchronous oscillation". The lower panels in figure 1 show the overall brain, and EEG activity as generated in simulations - from low frequency "theta" activity, through the alpha, beta and gamma ranges, to 40Hz. These progressive changes in frequency content reflect the overall level of cortical excitation. At the highest levels of excitation, the self-excited cortical state described in the top panels has been reached.
|